Gaining insight into the perception of your customer service operation is an important aspect of keeping customers happy, so WHMCS provides tools to help you measure support satisfaction. By asking for ratings of individual messages or conducting more in-depth surveys, data can be quickly obtained for analysis.
Providing good customer service and support is much more than just answering all the tickets; armed with information you can identify which policies and support approaches are working best and where to target staff training.
Response Time Statistics
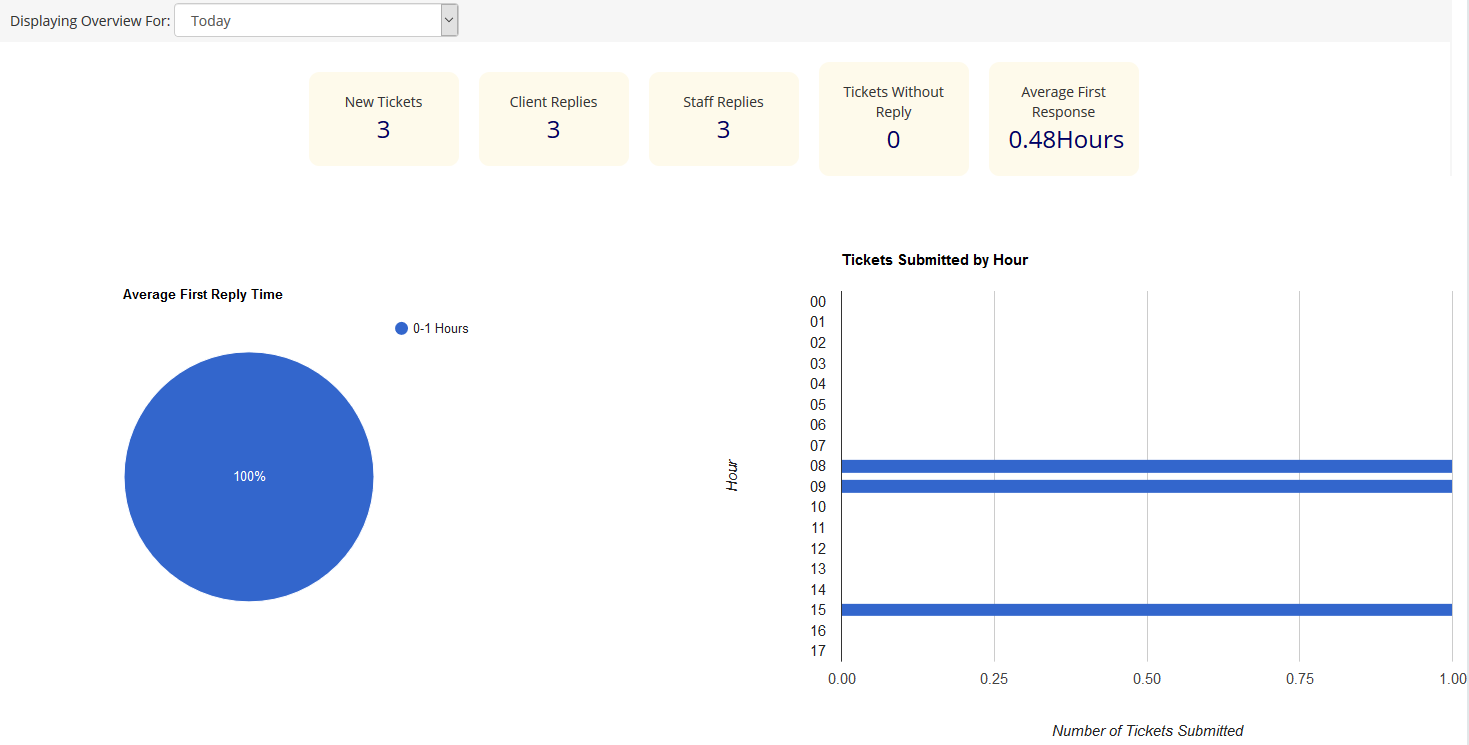
A key factor in maintaining customer satisfaction is ensuring that SLAs are being met and customers receive a response to their enquiry within the expected timeframe. The Support > Support Overview page provides statistics to measure this in real-time.
At the top is the date filter, allowing for comparison of today's performance against previous days, months or years.
Beneath that, the key ticket reply statistics demonstrate response efficiency, number of tickets unanswered, and the average time between ticket opening and the first staff response - a key metric.
At the bottom of the page are graphs illustrating the breakdown of response times, and the ticket volume by hour. This enables for effective staff assignment; making it easy to see when to increase staff levels during the busiest periods.
Support Ticket Ratings
A scale of 1-5 stars is displayed in the client area next to each ticket reply made by a member of staff. With a single click, clients can provide their opinion on an individual message. 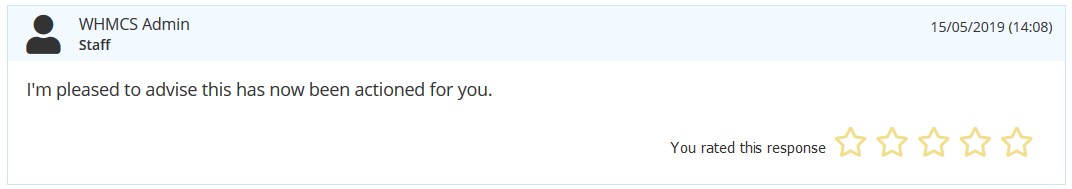
This rating system can be enabled system-wide and will appear next to every message by a member of staff in all departments. To enable:
- Navigate to Setup > General Settings > Support tab
- Tick the Support Ticket Rating checkbox
- Click Save Changes
The feedback ratings can be reviewed in the Support Ticket Ratings Reviewer report.
The report is filtered by rating and date, so you can quickly see the best and worst replies for a given period. The support ticket message and the member of staff who sent it are also listed, along with a link to view the full ticket, so you can quickly see the context of the rating.
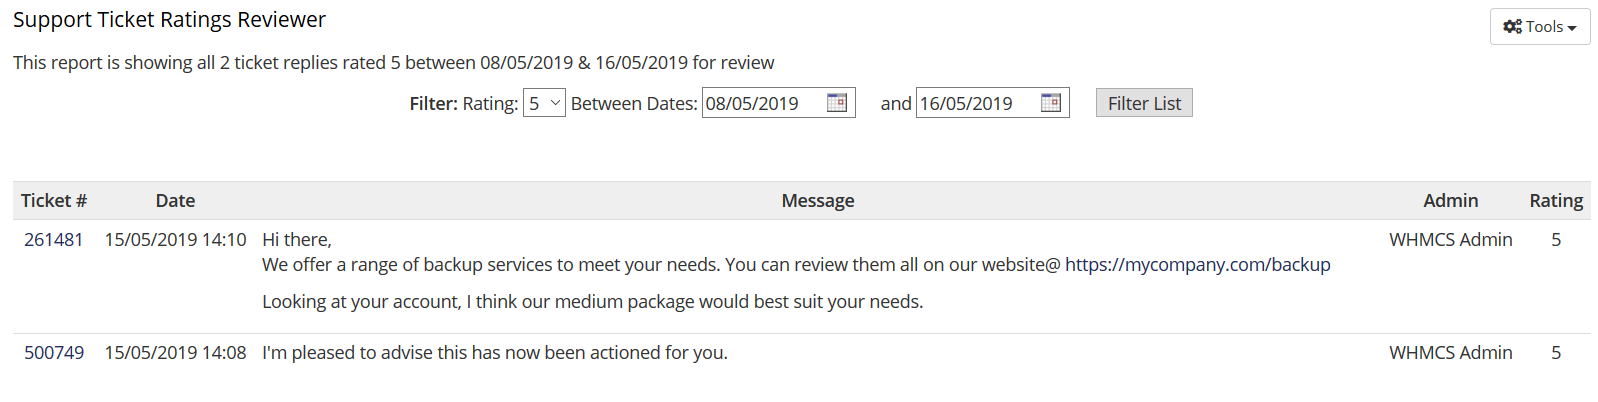
Like all reports, this data can be exported in CSV format via the "Tools" button permitting further analysis of the statistics using spreadsheet software. For example, counting the ratings received by each member of staff to see is the most or least successful.
Feedback Survey
Most people are familiar with receiving an email following an interaction with a customer service team asking for feedback on the experience. This typically links to an online survey asking containing several questions. This survey method provides the opportunity for customers to provide their own free-form comments in a guided way, for example to explain why a particular rating was given - this extra insight is valuable.
Feedback Surveys can be activated on a per-department basis, allowing targeting of feedback to specific departments, or excluding those for which it is not required. To enable:
- Navigate to Setup > Support > Support Departments
- Edit the department in question
- Tick the Feedback Request checkbox
- Click Save Changes
The "Support Ticket Feedback Request" email is sent when a ticket is closed inviting the user to complete a brief survey via a unique link that only they can use.
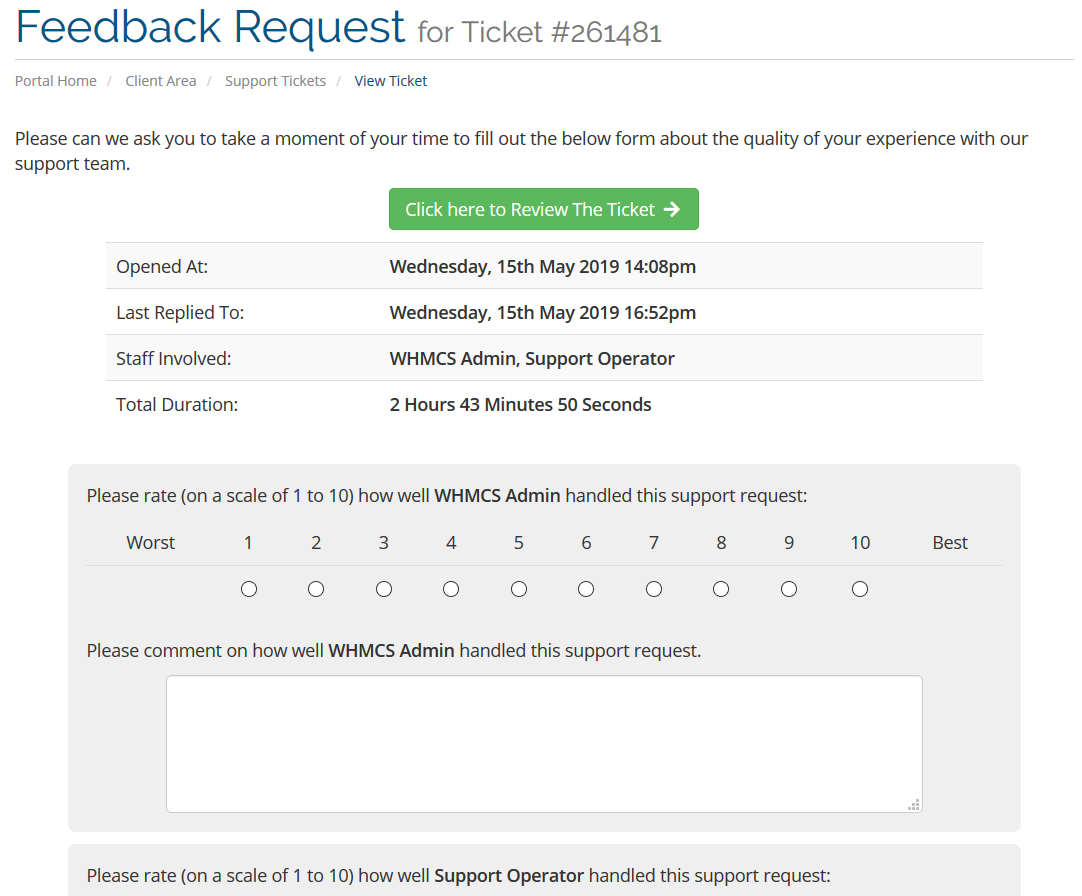
The survey page displays statistics about the ticket, provides a link to review the ticket to remind them who said what, and several fields for feedback.
For each staff member who replied to a ticket, a rating scale of 1-10 is provided, along with a comment box. A final comment box is provided asking for general suggestions for improvements, not related to an individual member of staff.
The survey submissions can be reviewed in two different reports:
- Ticket Feedback Scores
- Ticket Feedback Comments
The Feedback Scores report shows a graphical report of the average feedback score for each member of staff with the tabulated breakdown of ratings below.
The Feedback Comments report shows the feedback comments left alongside each rating, the member of staff it pertains to, and a link to view the full ticket. The comments provided in the final comment box are assigned to the user "Generic Feedback".

Both reports can be filtered by date, and data exported to a CSV for further analysis.
Armed with all this information you can ensure that support operations are operating efficiently, and customers are happy.
How have you used these tools, did you make any changes to your support operations or staffing as a result? We invite you to share your experiences in the comments below.