At WHMCS, our mission is to help web hosts be the most successful they can be. One of the ways we help web hosting businesses like yours do that is through the automation we offer. Automation of provisioning, automation of management of services and automation of billing. Together, these things increase efficiencies, reduce costs, and help you remain competitive in an ever increasingly competitive industry.
Automation is at the heart of what WHMCS does, and the Automation Insights available in WHMCS 7.1 and later give you complete transparency into what actions WHMCS is performing for you and any issues that may need your attention.
First introduced in 7.1, Automation Insights allows you to:
- easily see what actions have been performed
- dig into actions which have failed and require manual intervention to complete
- track trends over time with detailed charts and metrics
Dashboard Overview
The Automation Overview widget on the admin dashboard gives you a quick overview of many of the key automation metrics. 
With statistics for tasks such as invoice generation, payment captures, account suspensions, ticket closures and more, the widget provides a quick at-a-glance overview of automation activity for the past 24 hours. Also provided here are mini charts showing you the trends for the past 7 days allowing you to see how your business is performing over time. Click any of the mini charts to open a larger view with even more detailed information.
Automation Status
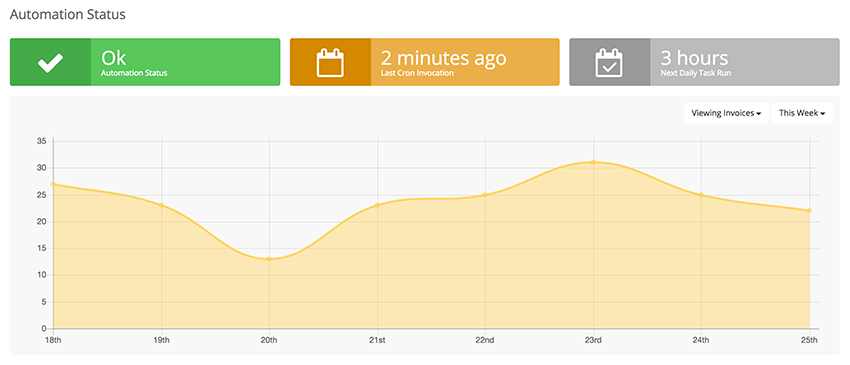
Accessed via Utilities > System > Automation Status, this functionality allows you to deep dive into the automation being performed by your WHMCS installation. First and foremost are the status indicators at the topmost of the page. These colored badges are designed to let you know whenever something isn't running correctly with the automation. Typically issues can include things such as the cron not being run frequently enough, or failing to be invoked at all. Look out for any warnings or notices here to alert you to potential issues.
Next up is the timeline chart. Located at the top of the page, this chart displays the activity for the selected metric over a selected period of time. You can choose from a range of metrics by clicking on the buttons indicated below. You can also choose between a range of time periods to view the data for. These graphs and charts allow you to see patterns and trends as they develop, and help you visualise the numbers to identify anomalies or issues.
Following the chart is the detailed metrics overview which displays the results from each run of an automation task.
Defaulting to today, using the calendar you can scroll back in time to any given date and see what happened, how many invoices were generated, how many charge attempts succeeded and failed, how many reminders were sent out, and more. This is a really powerful feature, and combined with the Module Queue, makes it easy to review any failures that are awaiting manual action and follow up.
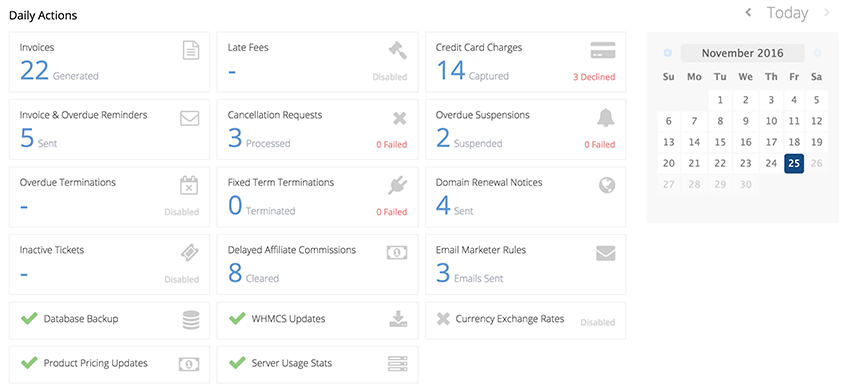
Any automated actions or tasks which are disabled, or which are not configured to run, will be indicated, such as the Inactive Tickets and Currency Exchange Rates task in the screenshot above.
The Automation Insights feature in WHMCS 7.1 and later is designed to make it easier for you to get a complete picture of the daily actions being carried out by your WHMCS installation, as well as making it easier to see failures and resolve them before they become a problem.
If you have any questions or suggestions for how we can make this feature even more useful, we invite you to leave your feedback in the comments below.